Graph Algorithms: Project Lines Committed vs. Project Age
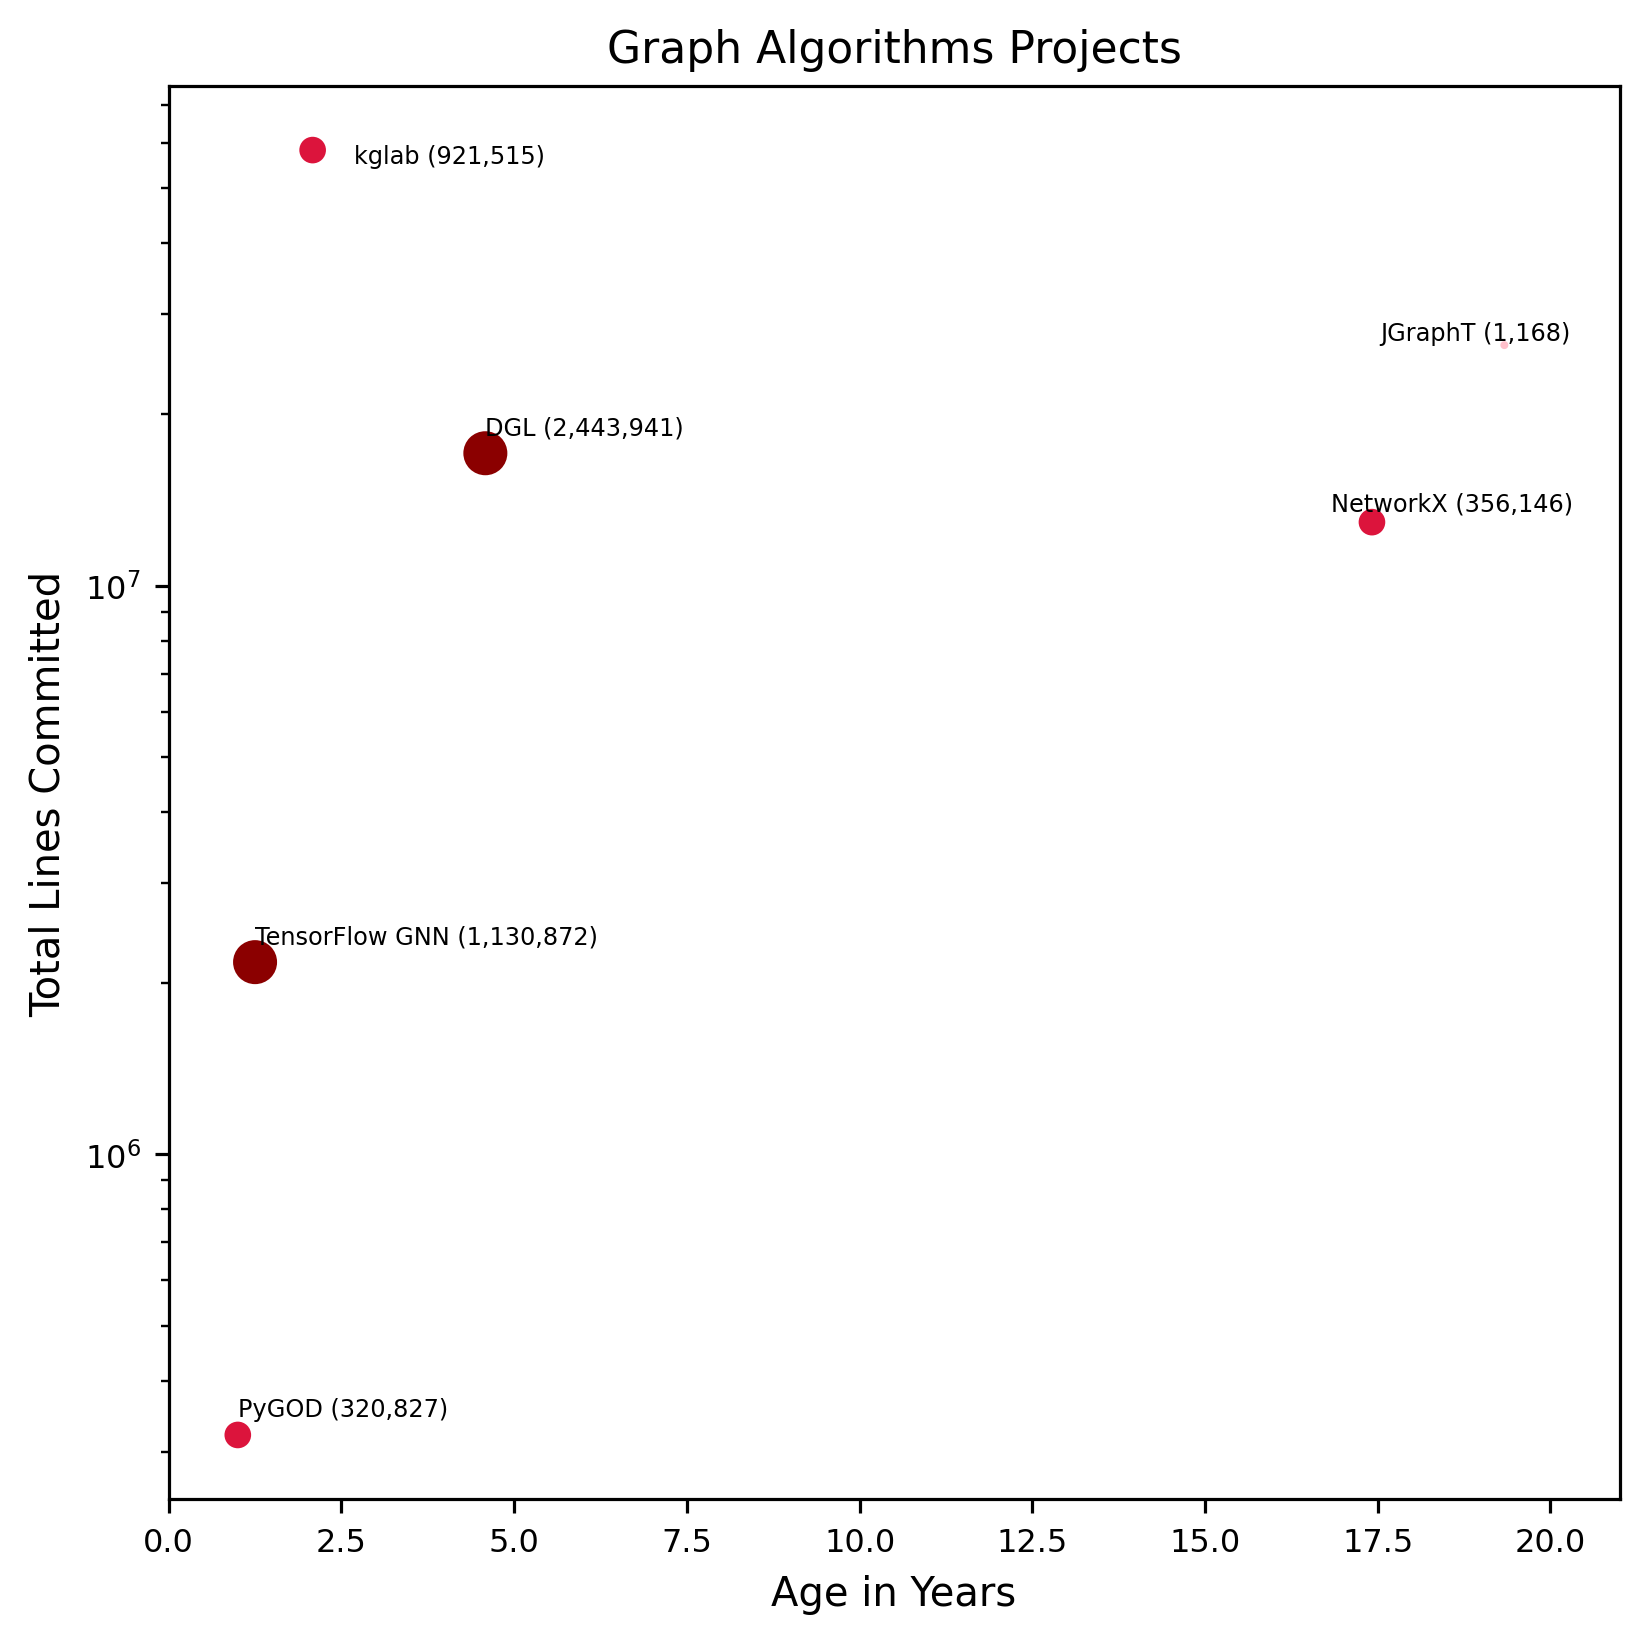
X Axis: age of the project, linear scale
Y Axis: total lines commited over entire history, log scale.
Markers: size and color correspond to lines commited over the last 12 months.
Labels: project name and total ines committed over last 12 months.